SiteAnalyzer is designed to thoroughly analyze websites, identifying technical issues such as broken links, duplicate pages, and incorrect server responses. It also detects SEO-related errors and gaps – including missing or empty meta tags, missing or duplicated H1 headers, poor page content, and low-quality internal linking – across more than 60 parameters in total.

Key Features
- Scanning of all pages of the site: images, scripts, documents, video and more
- Checking web-server response codes for each page of the site (200, 301, 302, 404, 500, 503, etc.)
- Finding the content of Title tags, Keywords, meta Description and H1-H6
- Finding and displaying "duplicate" of the: pages, meta tags and headers
- Determining the presence of the attribute rel="Canonical" for each page of the site
- Following the directives of the "Robots.txt", meta "Robots" or "X-Robots-Tag"
- Following the "Noindex" and "Nofollow" rules when crawling site pages
- Data scraping based on XPath, CSS, XQuery, RegEx
- Website content uniqueness checking
- Google PageSpeed score checking
- Domain analysis (WHOIS checker, CMS checker, searching for subdomains, keywords density, etc.)
- Hyperlink analysis: display of internal and external links for any page of the site
- Calculation of internal PageRank for each page
- Site Structure Visualization on the graph
- Checking and showing Redirect Chains
- Scanning an arbitrary external URL and Sitemap.xml
- Sitemap.xml generation (with the possibility of splitting into several files)
- Filtering data by any parameter
- Searching for arbitrary content on the site
- Exporting site structure to MindMap
- Exporting reports to CSV, Excel and PDF
Differences From Analogues
- Low demands on computer resources
- Scanning websites of any volumes
- Fast switching between projects
Documentation Index
- Getting Started
- Program Settings
- Main Settings
- Scanning Rules
- SEO
- Virtual Robots.txt
- Indexation Check
- User-Agent
- Custom HTTP headers
- Proxy-Server
- Exclude URLs
- Include URLs
- PageRank
- Authorization
- Analytics new
- White Label
- Work With The SiteAnalyzer
- Configure Tabs & Columns
- Data Filtering
- Technical Statistics
- SEO-statistics
- Custom Filters
- Custom Search
- Domain Analysis
- Data Scraping
- Content uniqueness checking
- PageSpeed score checking
- Site Structure
- Project List Context Menu
- Visualization Graph
- Internal Links Chart
- Page Load Performance Graph
- TOP Anchors
- Exporting to a MindMap
- Sitemap.xml Generation
- Virtual Crawling
- Scan Arbitrary URLs
- Dashboard
- URL Import
- Data Export
- Multilanguage Support
- Data Defragmentation
- Tariff
Getting Started
When you launch SiteAnalyzer, you’ll see an address bar where you can enter the URL of the website you want to analyze. You can input any page – the crawler will follow internal links from that page and scan the entire site, including the homepage.
- Clicking the "Start" button initiates the crawling process. The crawler follows internal links across the site (excluding external resources and JavaScript-based links) and compiles a detailed report in table format, organized under thematic tabs.
All scanned projects are displayed in the left panel and automatically saved in the program’s database along with the collected data. To remove unwanted projects, simply use the context menu in the project list.
Note:
- Clicking "Pause" stops the scan temporarily. The progress is saved to the database, allowing you to close and restart the scan later from the same point.
- Clicking "Stop" ends the scan completely and cannot be resumed.
Program Settings
The Settings section in the main menu is used to fine-tune the program’s behavior during site analysis. It includes 15 configurable tabs, with the Main Settings tab allowing users to adjust core scanning parameters.

The main settings section serves for specifying the user-defined directives used when scanning the site.
Description of the parameters:
- Number of Threads
- Determines how many URLs are processed simultaneously. A higher number increases speed but also uses more system resources. We recommend using between 10-15 threads for optimal performance.
- Scan Time
- Sets the maximum time (in hours) allowed for scanning a website.
- Maximum Depth
- Specifies how deep the crawler will follow internal links from the starting page. The homepage has a Crawl Depth of 0. For example, to scan pages like domain.com/catalog.html and domain.com/catalog/item.html, set the maximum depth to 2.
- Delay Between Requests
- Allows you to set pauses between page requests. This helps prevent overloading servers, especially for websites hosted on limited or low-performance hosting.
- Query Timeout
- Defines how long the program waits for a server response before moving on. This prevents slow-loading pages from significantly delaying the entire scan.
- Maximum Crawled Pages
- Limits the total number of pages crawled. Useful when analyzing large sites – for example, if you only need to scan the first X pages. Note that files like images, CSS, and scripts are not counted toward this limit.
Scanning Rules & Content Types

Content Types
- This section allows you to define which types of content the crawler should include or exclude during scanning – such as images, videos, stylesheets (CSS), and scripts (JS). You can customize these settings to focus only on the data that matters most for your analysis.
Scanning Rules
- These settings control how the crawler respects website exclusion rules, including:
- robots.txt directives
- nofollow link attributes
- meta name="robots" tags in page code
- By default, SiteAnalyzer follows standard crawling rules to ensure ethical and accurate site analysis.
Cookies Mode
- SiteAnalyzer supports three cookie-handling options:
- Permanent – Use this mode when accessing sites that require cookies. It maintains session continuity across requests. Recommended for most websites.
- Sessional – Each new request starts a new session.
- Ignore – Disables cookies entirely.
- We recommend using Permanent mode for the best compatibility with modern websites.
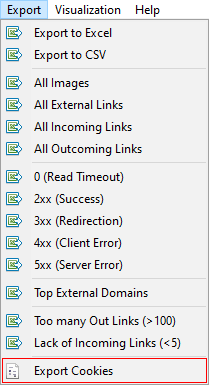
- You can also export all cookies from the currently analyzed site to a text file using the "Export Cookies" button in the main menu.

This section lets you define the main SEO parameters to be checked during page parsing. Once configured, these rules are applied across the site, and the results are displayed in the SEO statistics tab on the right side of the program window.
This feature allows you to use the SERPRiver service to check whether pages from your site are indexed in Google. It provides reliable insights into your site’s visibility in search results.


SiteAnalyzer supports the use of a virtual robots.txt file – an alternative to the physical robots.txt located at your site’s root.
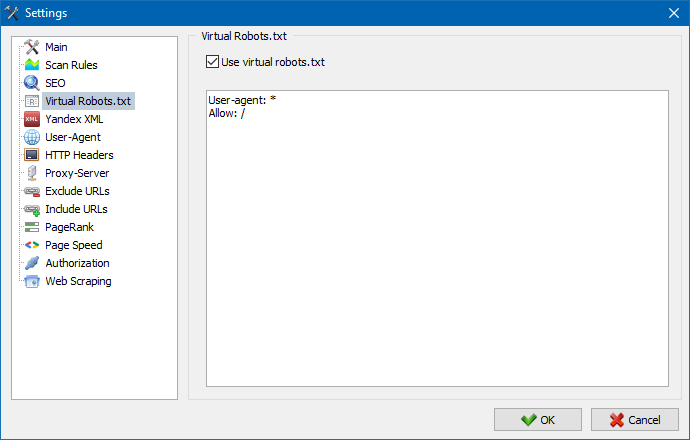
This is especially useful for testing or scanning specific sections of a website without affecting live server settings. You can simulate crawl restrictions without involving developers or modifying the real robots.txt.
The virtual robots.txt is stored in the program settings and applies to all projects.
Note: When importing a list of URLs, the virtual robots.txt rules will be applied only if this option is enabled. Otherwise, no robots.txt restrictions are considered during the scan.
In the User-Agent section, you can specify which user-agent string SiteAnalyzer will use when scanning websites. This determines how the server identifies the crawler during requests.

By default, SiteAnalyzer uses its own user-agent: SiteAnalyzerbot. However, you can choose from a list of common browser and search engine crawlers, including:
- Search Engine Bots: Googlebot, MicrosoftEdge, YandexBot.
- Desktop Browsers: Chrome, Firefox, Internet Explorer 8.
- Mobile Devices: iPhone, Android devices, and more.
You also have the option to define a custom User-Agent with any name or value you prefer.
This feature allows you to modify and send custom HTTP request headers when crawling a website. It gives you full control over how SiteAnalyzer interacts with the server.
For example:
- Send a specific Referer header.
- Set Accept-Language, Accept-Charset, or Accept-Encoding.
- Use custom values for Cache-Control, Pragma, or other less common headers.
- This is especially useful when analyzing multilingual sites, testing caching behavior, or simulating requests from specific clients.
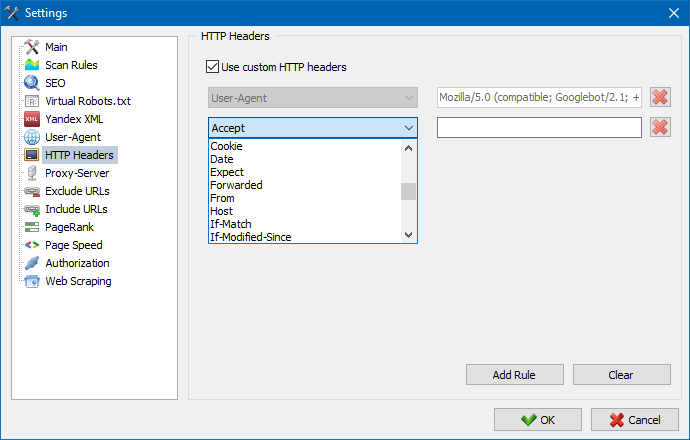
Note: The User-Agent header is configured in a dedicated tab under the User-Agent settings section.
If you're working behind a proxy, the Proxy Server section allows you to configure one or more proxy servers for SiteAnalyzer to use when accessing external resources.
You can:
- Add a list of proxy servers.
- Test proxies for performance and reliability.
- Remove inactive or non-responsive proxies.

This section allows you to prevent the crawler from scanning specific pages or sections of a website during parsing.

Using regular expressions, you can define URL patterns that should be excluded from the scan and not saved to the program’s database. These exclusions apply locally for the current scan – as opposed to the global exclusion rules defined in the robots.txt file located at the root of the site.
The tool also allows you to specify URLs that must be crawled. When this option is used, all pages outside the specified folders or patterns will be ignored during the scan.

The PageRank feature allows you to analyze your website’s internal link structure and optimize the distribution of link equity to prioritize important pages.

SiteAnalyzer offers two calculation methods: the classic algorithm and a modern alternative. In most cases, both produce similar results, so you can use either one for analyzing your site's internal linking.
For more details on how PageRank is calculated and how it applies to your website, read our article: calculation of internal PageRank.

Enter your login and password to enable automatic authentication on pages protected by .htpasswd and secured with BASIC server authorization.
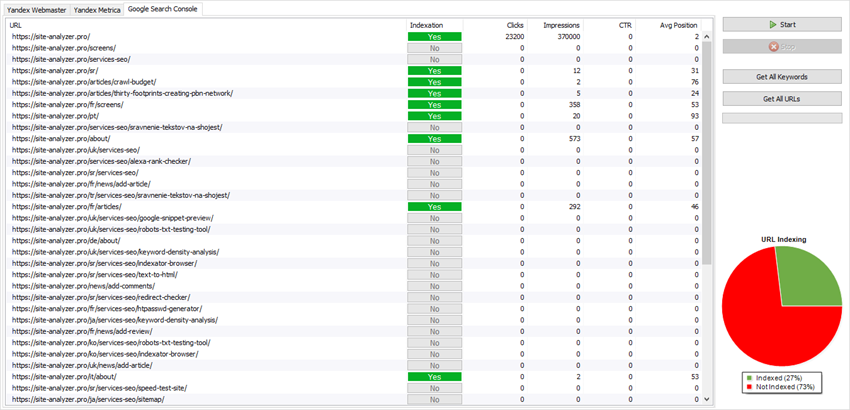
Integration of SiteAnalyzer with Google and Yandex analytics systems (Google Search Console, Yandex Webmaster, Yandex Metrica) now allows you to obtain information about the indexing of website pages, analyze the amount of incoming traffic to these pages, find out the bounce rate by URL, get the page depth view, check the indexing status of pages, receive a list of queries for which a particular page ranks, and export all this data to Excel.
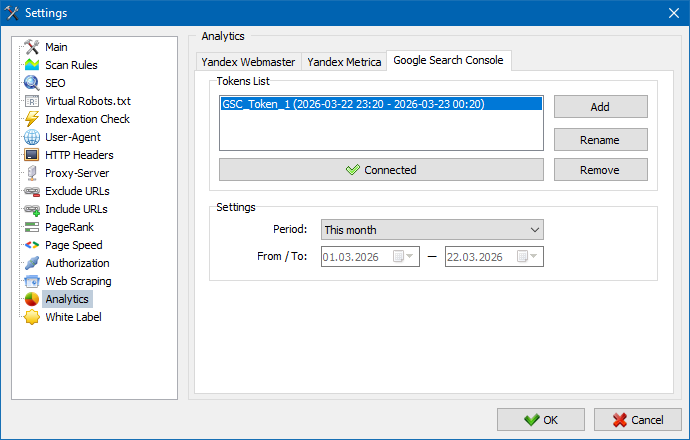
For a detailed description of how to work with the analytics module, read the article SiteAnalyzer 3.3.
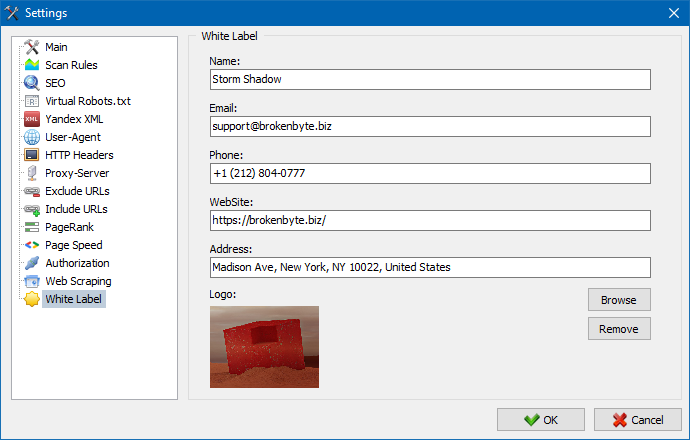
The White Label feature allows you to brand audit reports with your own company identity - making it ideal for agencies and consultants who want to present results under their own brand.
By default, exported reports include the SiteAnalyzer logo and contact details. With White Label enabled, you can replace them with your own: Company logo, Email, Phone number, Address, Website URL, Company name.
To set this up, go to the Settings section and click the White Label button. Fill in your company details, and from that point on, all generated reports will reflect your branding.
For more information, check out the SiteAnalyzer 2.7 release notes.
Working With The SiteAnalyzer
Once the scan is complete, data in the "Main Data" section becomes available. Each tab organizes information by type – for example:
- The "Title" tab displays content from the TITLE tag.
- The "Images" tab lists all images found on the site.
- Other tabs contain similar structured data for meta tags, headers, links, and more.
This structure allows you to analyze your site’s content, identify broken links, and detect incorrectly filled or missing SEO elements.

If needed – for example, after making changes to your website – you can use the context menu to re-scan individual URLs, so only updated pages are rechecked.
You can also use the same menu to identify duplicate pages based on key parameters such as duplicate titles, descriptions, keywords, H1-H2 tags, or full content matches.

The "Rescan URL with code 0" option lets you automatically re-check pages that returned response code 0 (Read Timeout). This status typically occurs when the server fails to respond within the expected time, causing the connection to close before the page can be fully loaded and analyzed.
Now you can customize which tabs appear in the main data interface – making it easy to remove less-used sections like the outdated Meta Keywords tab. This is especially useful when screen space is limited or when you want to streamline your workflow.

You can also rearrange or hide columns by simply dragging and dropping them to your preferred position.
To manage visible tabs and columns, use the context menu in the main data panel. Column order can be adjusted using drag-and-drop with your mouse.
To make site data analysis more efficient, SiteAnalyzer includes a powerful filtering system. You can filter information in two ways:
- Quick Filter – Apply a simple search across all fields in the current tab for fast results.
- Custom Filters – Custom filters allow for advanced, multi-condition filtering to help you extract highly specific data from your site analysis.
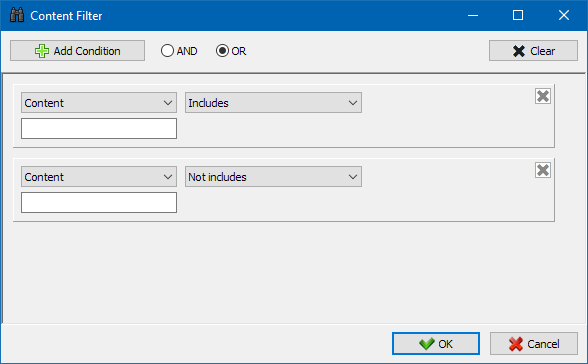
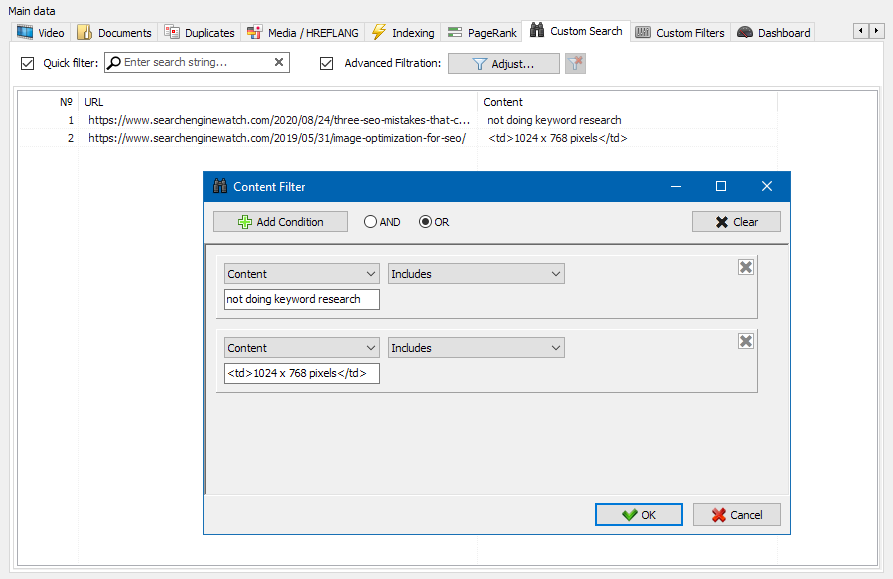
For example, suppose you want to filter pages based on the TITLE tag – showing only those with:
- A title length of 70 characters or less.
- The word "news" in the title.
- You can set up both conditions in a single custom filter. The result of the filtering is shown on the picture below:

By applying custom filters to any tab, you can create complex data samples tailored to your exact needs – helping you uncover insights that standard filters might miss.

With these tools, you can easily narrow down large datasets and focus on the most relevant information from your website – helping you identify SEO issues, technical errors, and actionable insights faster.
The Technical Statistics tab is located in the Additional Data panel and provides an overview of key technical parameters of the site – including link statistics, meta tag usage, HTTP response codes, indexing status, content types, and more.
Clicking on any parameter automatically filters the data in the corresponding tab of the Main Data section. At the same time, detailed statistics are displayed in a chart at the bottom of the page for quick visual analysis.

The SEO Statistics tab is designed for comprehensive site audits and includes over 50 core SEO parameters that help identify more than 60 common internal optimization issues.
Errors are grouped into categories, each containing sets of analyzed parameters and filters that automatically detect problems across your site.
You can quickly export any filtered results directly to Excel – no additional confirmation dialogs required. The report is saved automatically in the program folder for easy access.

For a full breakdown of all checked parameters, refer to the SiteAnalyzer 1.8 release notes.
The Custom Filters tab includes a set of predefined filters that help you quickly create data selections for various site elements – such as external links, 404 errors, images, and more – along with the list of pages where they appear.

For example, you can easily generate a list of all external links and see exactly which pages contain them – or extract all broken links and view their exact locations on your site.
All filtered results are displayed directly in the program under the "Custom" tab of the Master Data panel. You can also export any selection to Excel via the main menu.
The Custom Search feature allows you to search through page source code and locate web pages that contain specific content – making it easy to find exactly what you're looking for.
With the Custom Filters module, you can search for:
- Micro-markup and structured data.
- Meta tags and web analytics scripts.
- Specific text or HTML fragments.
The filter settings window offers multiple options for locating exact phrases or code elements across your site. You can also exclude certain words or HTML snippets from the results – offering functionality similar to a browser’s Ctrl+F search, but with advanced filtering capabilities.
SiteAnalyzer now includes 6 powerful domain analysis modules, available directly from the context menu of the project list. These tools provide in-depth insights into domain-related data and are ideal for SEO audits, competitor research, and technical investigations.
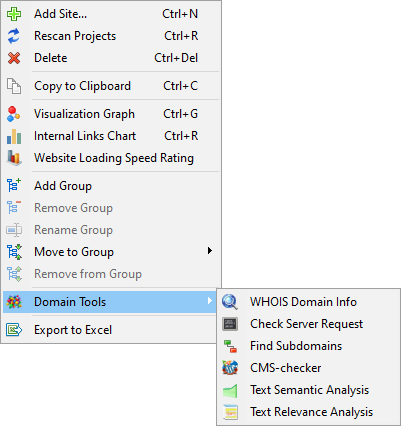
Available Modules:
- WHOIS Domain Info
- This module performs bulk lookups of domain registration details, including:
- Domain age (in years).
- WHOIS data: registrar, creation date, expiration date.
- Name servers (NS), IP address, owner organization, and contact email (if public).
- Useful for evaluating domain authority, ownership, and historical background.
- This module performs bulk lookups of domain registration details, including:
- Server Response Check
- Checks the HTTP response code returned by a server when accessing a page. Common codes include:
- 200 OK – Page loaded successfully.
- 404 Not Found – Page does not exist.
- 301 Moved Permanently, 403 Forbidden, 500 Internal Server Error, etc.
- This helps identify server issues or broken resources across multiple domains.
- Checks the HTTP response code returned by a server when accessing a page. Common codes include:
- Subdomain Finder
- Automatically searches for subdomains associated with a given website using targeted search engine queries. This is especially useful for analyzing large websites, online stores, or portals.
- The tool finds both active and forgotten subdomains that may still be indexed or used for testing.
- CMS Checker
- Detects the content management system (CMS) used by a single website or a batch of sites. The module identifies CMS types by scanning source code patterns – no manual inspection required.
- Supports fast identification of CMS platforms across dozens of websites at once.
- Text Semantic Analysis
- Analyzes key SEO metrics of on-page content, including:
- Word count and text length.
- Keyword density (including "keyword stuffing" detection).
- Readability score.
- Helps ensure content quality and optimization levels.
- Analyzes key SEO metrics of on-page content, including:
- Text Relevance Analysis
- Designed specifically for SEO specialists, this module evaluates how relevant a web page is to specific search queries.
- It checks for:
- Presence of H1 tags.
- Use of keywords in TITLE and BODY.
- Total character count.
- Exact keyword phrase matches in the text.
- This helps determine whether a page is ready for promotion or needs further optimization.
- Batch Processing & Export
- Most domain analysis modules support batch processing, allowing you to analyze multiple domains at once. Results can be exported to CSV files or copied to the clipboard for easy sharing or further analysis.
For more information, check out the SiteAnalyzer 2.8 release notes.
SiteAnalyzer supports multiple web scraping methods, including:
- XPath
- CSS Selectors
- XQuery
- Regular Expressions (RegExp)
- HTML Templates
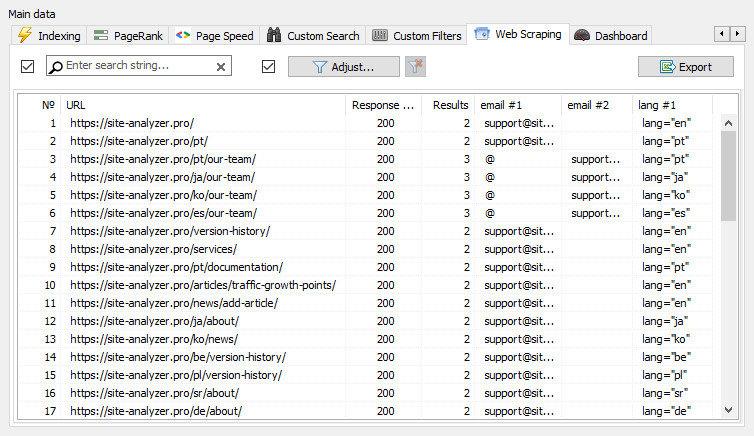
These tools allow you to extract structured data from websites with precision and flexibility.
Why Use Web Scraping?
- Web scraping is ideal for automating tasks that would be difficult or time-consuming to perform manually. Typical use cases include:
- Extracting product descriptions and pricing when building an online store
- Monitoring prices or advertisements across multiple websites
- Gathering market and competitor data for SEO and marketing research
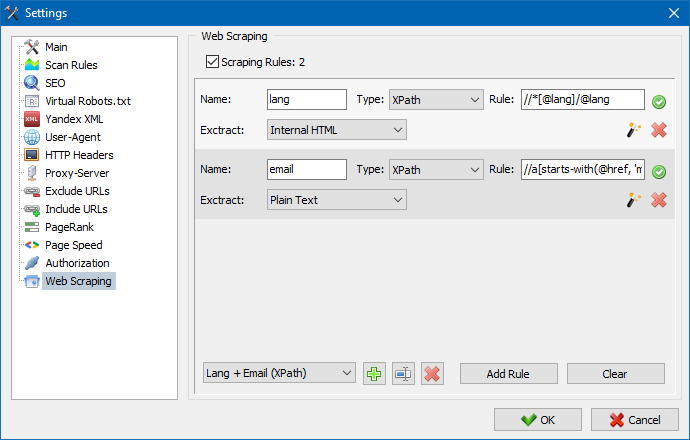
- Configure Scraping Rules
- You can define and manage your scraping rules in the Data Extraction tab. This allows you to create reusable extraction patterns – which you can edit or refine as needed.
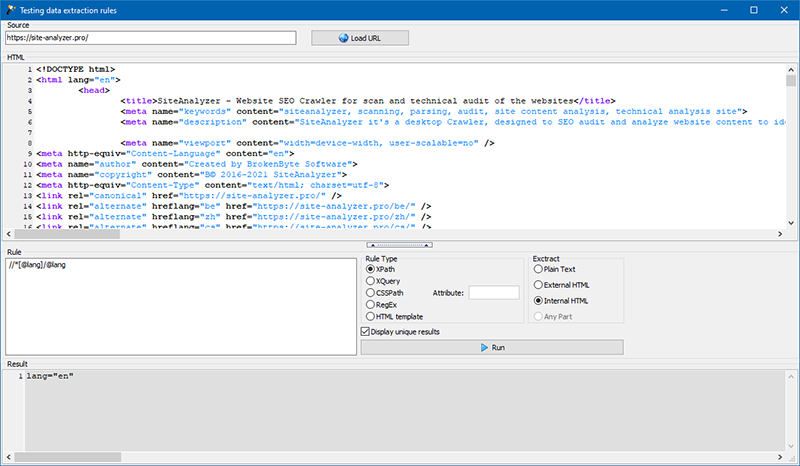
Rule Testing Module
- The built-in rule debugger makes it easy to test your scraping logic on any page. You can:
- View the HTML source of a page
- Simulate HTTP requests
- Test and adjust your parsing rules in real time
- Once tested, these rules can be used for full-scale data extraction within SiteAnalyzer.
Export Collected Data
- After scraping is complete, all extracted data can be exported directly to Excel, making it simple to analyze, share, or integrate into other systems.
For more information, including examples of commonly used rules and regular expressions, read our guide: How to Parse and Extract Data from a Website for Free.
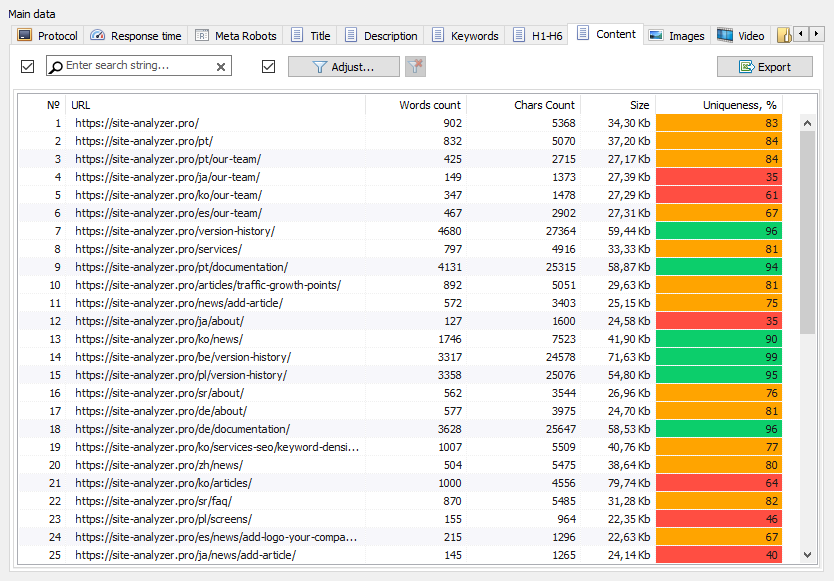
SiteAnalyzer includes a built-in tool for detecting duplicate and near – duplicate content across pages within the same website. It allows you to perform bulk comparisons, helping you identify both full and partial duplicates.
This feature is especially useful for:
- Identifying duplicate URLs (e.g, SEF and non-SEF versions of the same page).
- Finding partially similar content – such as two articles that are 96% identical (common in content-heavy blogs or recipe sites), which may lead to SEO cannibalization.
- Preventing accidental re-publication of older content on long-running blogs or corporate websites.
How It Works
- The tool analyzes text content by comparing shingles – short sequences of consecutive words – across pages. Here's the process:
- The program downloads content from the provided list of URLs.
- HTML tags and <head> sections are removed to extract clean text.
- The system compares pages using the Shingle algorithm, analyzing text segments to determine similarity.
- Results show matches ranging from 100% unique to fully duplicated or partially overlapping content.
- The tool uses 5-word shingles, allowing it to detect subtle variations and similarities with high accuracy.
Why It Matters
- By identifying duplicate or redundant content, you can improve SEO performance, avoid internal competition between pages, and maintain content quality across your site.
- For more information, read our guide: How to Check a Large Number of Web Pages for Duplicate Content.
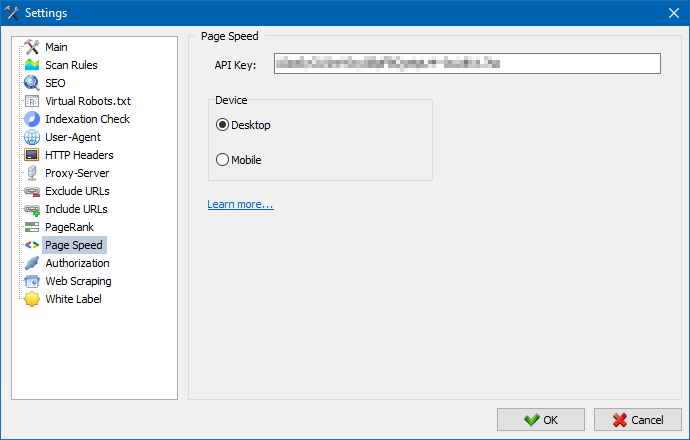
SiteAnalyzer includes a free built-in module that lets you check the performance metrics of multiple pages at once using the Google PageSpeed Insights API.
Key Performance Metrics Analyzed:
- FCP (First Contentful Paint) – Measures when the first content appears on the page (user-perceived load speed).
- SI (Speed Index) – Shows how quickly the visible parts of the page are populated.
- LCP (Largest Contentful Paint) – Tracks when the largest content element in the viewport becomes fully loaded.
- TTI (Time to Interactive) – Measures how long it takes for a page to become fully interactive.
- TBT (Total Blocking Time) – Calculates how long the main thread is blocked during page load.
- CLS (Cumulative Layout Shift) – Assesses visual stability by tracking unexpected layout shifts.
Thanks to SiteAnalyzer’s multi-threaded architecture, you can analyze hundreds or even thousands of URLs in just a few minutes – something that would take hours or days if done manually.
Once the analysis is complete, you can export all results into a ready-to-use Excel report with a single click.
To get started, you’ll need a Google PageSpeed Insights API key.
For step-by-step instructions, read our guide: How to Check Website Speed Metrics in Bulk.
This feature allows you to generate a visual representation of your website’s structure based on crawled data. The structure is built according to the nesting level of URLs, showing how pages are organized and interconnected.
Once the analysis is complete, you can export the site structure to CSV format, making it easy to open in Excel or use for further analysis.
Use this tool to better understand your website’s architecture, identify orphaned pages, and improve internal linking strategies.

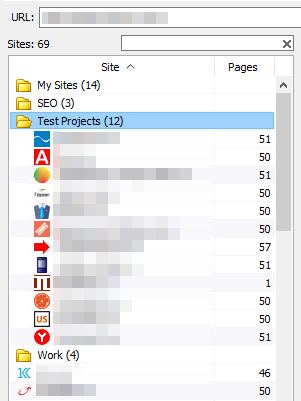
The project list includes several time-saving options to help you manage multiple websites efficiently.
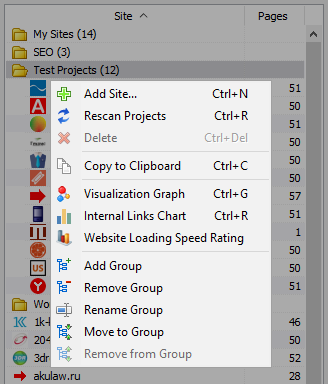
- Mass Scanning: Select multiple projects and click the "Rescan" button to queue them for scanning. Sites will be reprocessed one by one in standard mode.
- Bulk Deletion: Selected projects can be removed quickly using the "Delete" button.
- Bulk Project Import: Use the special import form to add multiple websites to your project list at once – allowing you to scan only the sites you're interested in, when you need to.
- Organize with Folders: Group your projects into folders for better organization and easier navigation.
- Filter Projects: Filter the list by project name or other criteria to quickly locate the site you're looking for.

- These features make managing large sets of websites fast, intuitive, and efficient.
Link Structure Visualization (Graph Mode)
The interactive Visualization Graph helps SEO specialists assess internal link distribution and understand how PageRank flows through a website.

By visualizing the site’s link structure, you can easily identify:
- Pages that receive the most internal link equity.
- Sections with strong or weak internal linking.
- Orphaned pages with little or no internal support.
This feature gives you a clear picture of your site’s architecture – helping you optimize internal linking and boost the relevance of key pages in search engines.
Key Features of the Visualization Window
- Located on the left side of the graph interface, the control panel provides access to essential tools:
- Zoom In/Out – Adjust the view for better detail or overview.
- Rotate Graph – View the structure from any angle.
- Full-Screen Mode (F11) – Expand the visualization for detailed analysis.
- Show/Hide Node Labels (Ctrl + T) – Toggle display of page names and URLs.
- Show/Hide Arrows – Control visibility of directional links between nodes.
- Show/Hide External Links (Ctrl + E) – Focus only on internal connections.
- Day/Night Mode Switching (Ctrl + D) – Choose between light and dark themes.
- Show/Hide Legend & Statistics (Ctrl + L) – Access additional data about the graph.
- Save as PNG Image (Ctrl + S) – Export the current view for reports or presentations.
- Open Visualization Settings (Ctrl + O) – Customize appearance and behavior of the graph.
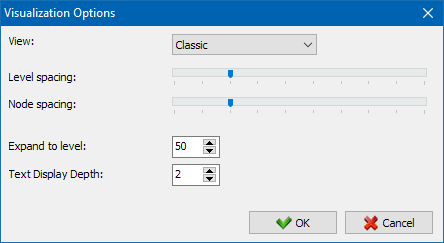
Visualization Modes
- PageRank Mode
- In this mode, node sizes are proportional to their calculated PageRank value, allowing you to visually identify:
- Pages with the strongest internal authority.
- Pages receiving the least internal link weight.
- This is especially useful for optimizing internal link equity distribution.
- In this mode, node sizes are proportional to their calculated PageRank value, allowing you to visually identify:
- Classic Mode
- In "Classic" mode, node sizes correspond to the selected scale within the graph – ideal for general structural review and navigation.
Use this powerful tool to improve your internal linking strategy and make data-driven decisions for better SEO performance.
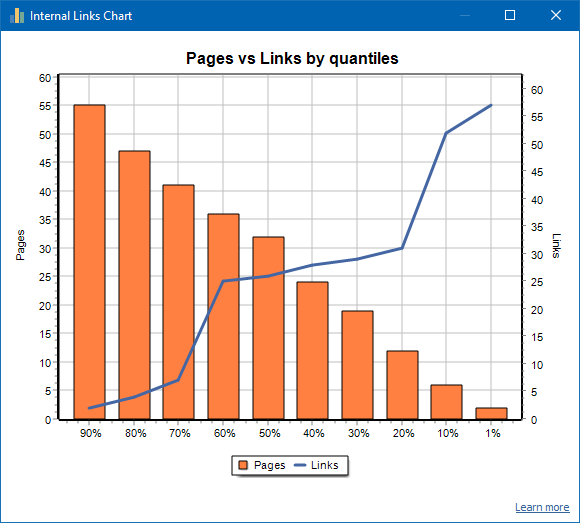
The Internal Links Chart provides a unique visual perspective on how link equity (often referred to as "link juice") is distributed across your website – complementing the Visualization Graph with statistical depth.
- The left side of the chart shows individual pages.
- The right side represents the internal links pointing to those pages.
- The bottom axis displays quantiles – showing the distribution of internal links across the site.
- Duplicate links are excluded from the visualization. For example, if page A has three internal links to page B, it will be counted as a single connection to avoid skewing the data.
Example: Internal Link Distribution on a 70-Page Website
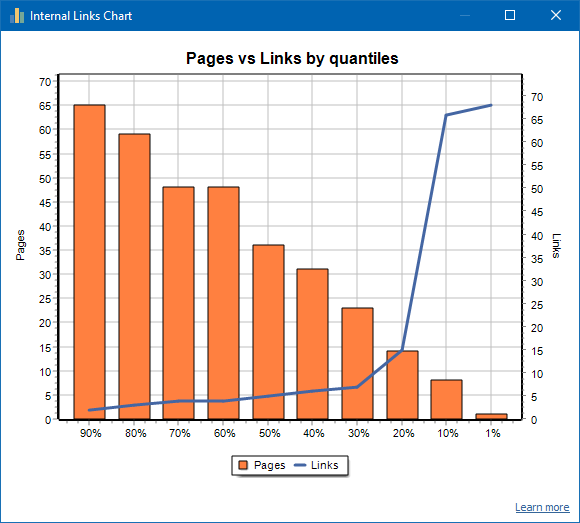
Here’s what the chart might show:
- PERCENTILE / AVG. INBOUND LINKS
- 1% / ~68
- 10% / ~66
- 20% / ~15
- 30% / ~8
- 40% / ~7
- 50% / ~6
- 60% / ~5
- 70% / ~5
- 80% / ~3
- 90% / ~2
This indicates that only the top 10-20% of pages receive strong internal linking, while the majority have limited support.
Pages with fewer than 10 inbound internal links typically suffer from weak internal linking, which can lead to reduced crawl frequency by search engines – especially Googlebot.
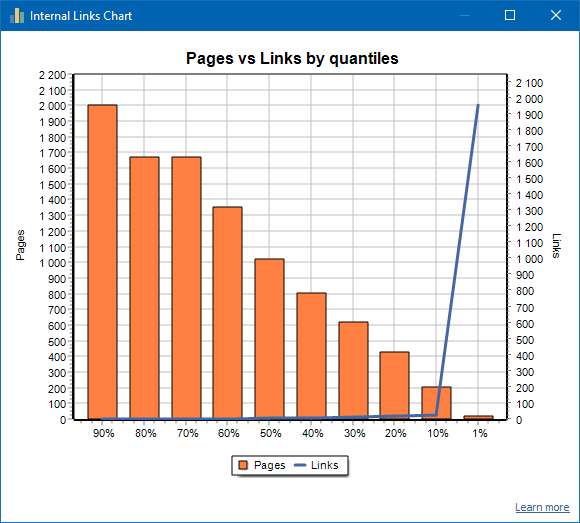
What This Means for SEO
If only 20-30% of your site’s pages have a solid internal link profile, consider optimizing the rest of your content:
- Add more strategic internal links to under-linked but valuable pages.
- Consider noindexing, redirecting, or removing low-priority pages that aren’t worth optimizing.
- Improving internal link equity helps boost visibility, improve crawling efficiency, and strengthen the overall architecture of your site.
Visual Examples
Below are two real-world examples:
A website with a poor internal linking structure
A website with a well-balanced internal linking strategy
These visuals help you understand what good vs. bad internal linking looks like – and how your own site compares.
The Page Load Performance graph helps you analyze how quickly your website’s HTML pages load. For better visualization, pages are grouped into time intervals using a 100-millisecond step.
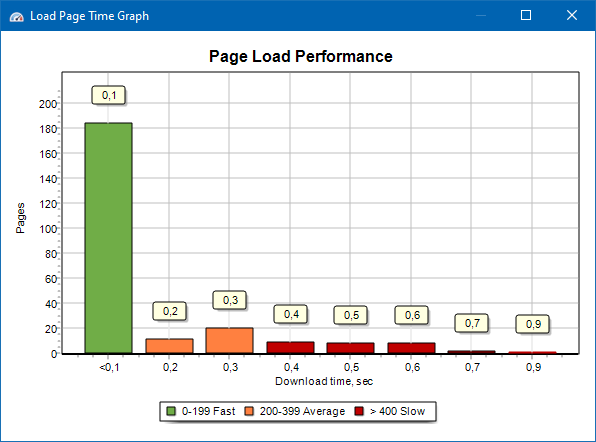
This allows you to quickly see:
- How many pages load within 0-100 milliseconds (fast).
- How many take 100-200 milliseconds (moderate).
- Which pages take 400 milliseconds or more (slow).
- This breakdown makes it easy to identify performance trends and prioritize optimization efforts.
Note: The graph reflects the time taken to load the HTML source code only – not the full page rendering time. It does not include additional delays caused by JavaScript execution, image loading, or CSS/JS rendering.
The Top Anchors filter, located in the Custom Filters panel, helps you analyze the most frequently used anchor texts across your website – including both internal and external links.
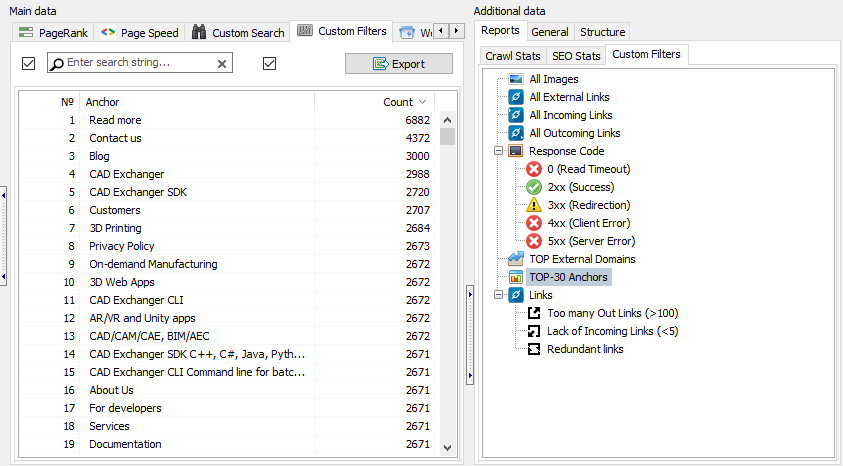
During analysis, SiteAnalyzer counts how many times each anchor appears and displays the results in a table and an accompanying graph. The graph visualizes the top 30 most common anchors, making it easy to spot overused or under-optimized link text at a glance.
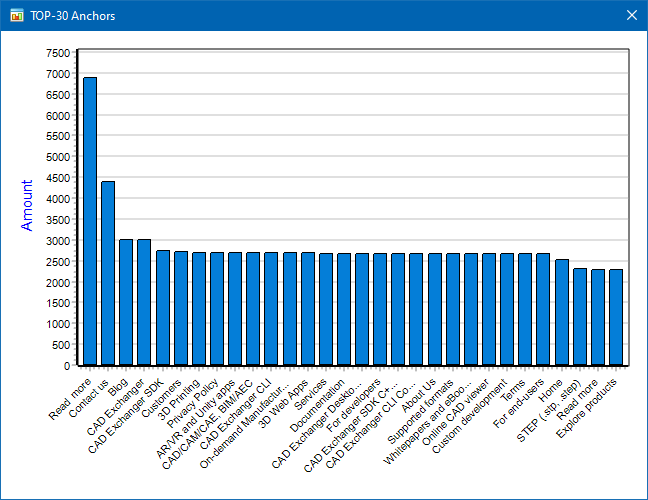
This feature is especially useful for evaluating link relevance, optimizing internal linking strategy, and identifying keyword-stuffed or unnatural anchor patterns that may impact SEO performance.
SiteAnalyzer allows you to export your website’s structure into an interactive MindMap format – giving you a clear, visual representation of your site architecture.
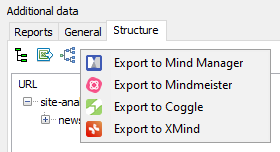
This feature enables you to analyze, present, or restructure your website using familiar visual mapping software – making it ideal for planning redesigns, improving internal linking, or documenting site structure for clients and teams.
In just a few clicks, transform complex website data into a well-organized, easy-to-understand visual layout.
For more details, check out the SiteAnalyzer 2.9 release notes.
Sitemap.xml Generation
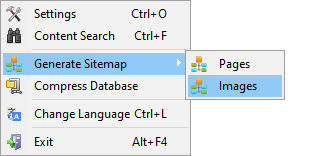
SiteAnalyzer allows you to generate a sitemap based on crawled pages or images – making it easy to create SEO-friendly sitemaps for submission to search engines.
- When generating a page-based sitemap, only URLs with content type text/html are included.
- For an image-based sitemap, the tool adds image files such as JPG, PNG, GIF, and other common formats.
You can generate a sitemap immediately after completing a site scan via the main menu: Projects → Generate Sitemap.
For large websites (starting from 50,000 pages), the program automatically splits the sitemap into multiple files – in compliance with search engine requirements for handling large sitemaps. The main sitemap.xml file will include links to these sub-files, which contain the actual page listings.

If needed, you can adjust the default split threshold (50,000 pages per file) in the program’s settings to suit your specific needs.
Virtual Crawling Mode
The Virtual Crawl feature allows you to scan websites without using the database, which significantly improves performance – especially on systems with slower HDDs or entry-level SSDs. All data is stored in memory and remains available only during the current session and until you switch to another project.
This mode is ideal when you need a fast, lightweight analysis without saving long-term data.
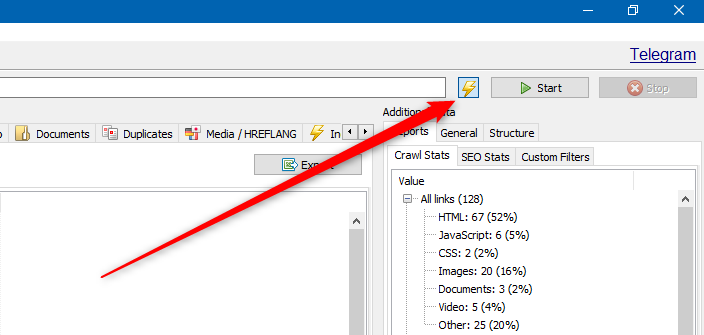
How to Enable Virtual Crawling
- A toggle switch for Virtual Crawling is located next to the Start and Stop buttons in the top panel of the program.
- Switch Off – The site is scanned in standard (classic) mode.
- Switch On – The site is scanned in Virtual Crawling mode.
Pros and Cons of Virtual Crawling
- Advantages:
- Faster scanning speed, especially on slower drives.
- Reduced resource usage.
- Quick setup and analysis without database overhead.
- Full access to all analytical tools (filters, reports, visualization graph, etc.).
- Limitations:
- Data is not saved after closing the program or switching projects.
- Not suitable for long-term storage or later reference.
- Despite these limitations, the functionality remains identical to classic scanning – including support for filters, custom sampling, and link visualization.
Important Note. The Virtual Crawling mode is available only under paid license plans.
Scan Arbitrary URLs
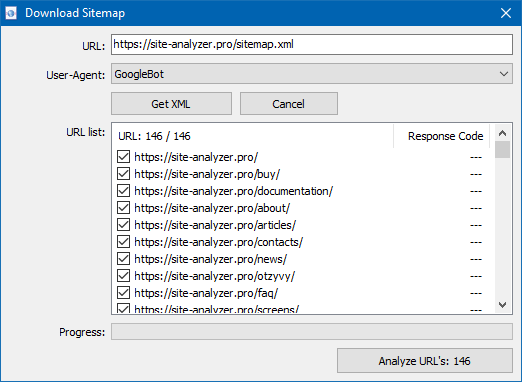
The "Import URL" feature allows you to scan custom lists of URLs or load sitemap.xml files (including index sitemaps) for immediate analysis – without creating a full project.
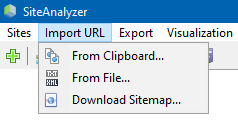
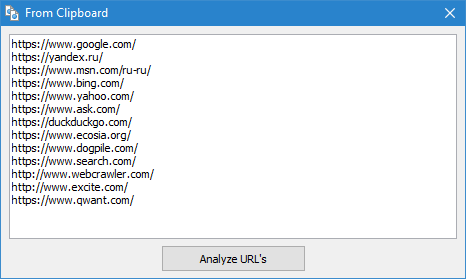
You can import URLs in three ways:
- Paste from clipboard.
- Load from .txt or .xml files stored on your hard drive.
- Download directly from the website using the built-in importer.
Key Features of This Mode
- This mode is especially useful when you want to:
- Quickly analyze specific pages.
- Check content from external sitemaps.
- Review targeted URLs without storing them in the database.
- Please note that imported URLs are processed without saving the project – meaning no data is stored permanently in the program’s database.
- As a result, the following sections will not be available during this session:
- Site Structure
- Dashboard
These limitations help keep the process lightweight and fast, ideal for one-time scans and quick checks.
For more details, refer to the SiteAnalyzer 1.9 release notes.
Dashboard
The Dashboard tab provides a comprehensive overview of your website’s current optimization status. The report is generated based on data from the SEO Statistics tab and includes a general site quality score, calculated on a 100-point scale – reflecting the current level of technical and SEO optimization.

This overall score helps you quickly assess how well your site is optimized and highlights areas that need improvement.
In addition to performance metrics, the Dashboard offers the option to export all data into a neatly formatted PDF report, making it easy to share results with clients or team members.
URL Import
The URL Import feature is useful in a variety of scenarios – especially when you want to update an existing project with new pages without rescanning the entire site.
For example, if you’ve already scanned a large website and want to add or analyze only a subset of new URLs, this feature lets you do so quickly and efficiently.
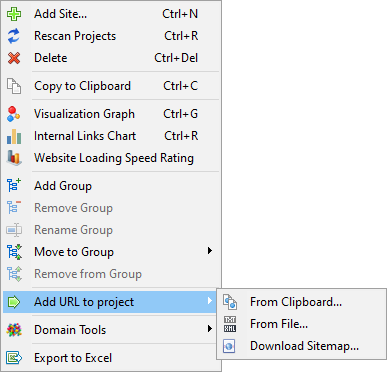
You can import URLs into a project in two ways:
- Through the context menu in the project list.
- Using the "Add URLs to Project" option from the context menu of the URLs list.
- This helps save time and resources while keeping your data up to date.
For more details, check out the SiteAnalyzer 2.9 release notes.
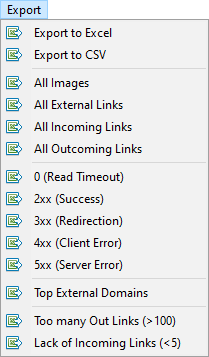
Data Export
To support deeper analysis and reporting, SiteAnalyzer offers flexible export options that let you work with your data outside the program.

You can export data in the following formats:
- CSV – Exports the currently active tab for easy use in spreadsheet tools or data processing workflows.
- Microsoft Excel (XLSX) – Generates a comprehensive report containing all tabs in a single file, preserving structure and detail.
When exporting to Excel, a dedicated configuration window appears, allowing you to select only the columns you need. You can then generate a clean, customized report tailored to your specific requirements.

This feature makes it easy to share findings, create client reports, or conduct further analysis using your preferred tools.
Multilanguage Support
SiteAnalyzer supports multiple languages, allowing you to choose your preferred interface language for a more comfortable user experience.

Supported Languages: English, German, Italian, Spanish, French, and more than 15 of the most popular languages.
You can easily switch between available languages directly in the program settings.
Want to Contribute a New Translation?
- If you'd like to translate SiteAnalyzer into your language, simply translate any *.lng file into your target language and send it to us at support@site-analyzer.pro. Please include your comments or notes in English, so we can integrate your translation into a future release.
- Detailed instructions on how to create and format translations are included in the program distribution package (lcids.txt file).
Found an Issue with a Translation?
- If you notice any inaccuracies or errors in the current translations, please share your feedback using the feedback form – we appreciate your help in improving the quality of our multilingual support.
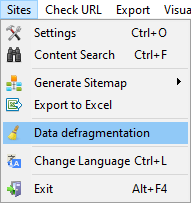
Data Defragmentation
The Data Defragmentation feature, available in the main menu, is used to optimize and clean the internal database – similar to defragmenting a hard drive.
This function performs two key tasks:
- Removes leftover data from deleted projects.
- Reorganizes and compresses the database to improve performance and reduce file size.
- It’s especially useful after removing large projects with thousands of URLs and records. Over time, deleted data can leave gaps in the database, which may affect speed and efficiency.
We recommend running the defragmentation process periodically, especially if you work with multiple large-scale projects or notice slower performance.
Keep your database lean and efficient – use Data Defragmentation to maintain optimal program performance.