934
934We are excited to introduce the integration of the “SiteAnalyzer SEO Tools” browser extension with “Google Search Console” – now, literally with just a couple of clicks, you have access to more than 15 advanced filtering, sorting, and comparison tools for efficient site auditing, including display of keywords and pages in search, dynamics of search query positions, page impression statistics and their average CTR chart, country-level geography breakdown, page cannibalization, and much more. We’ll tell you all about it in detail.
If you’re tired of juggling multiple tabs just to analyze Google Search Console data and want instant access to detailed keyword insights for a specific page or domain – now it’s all available right in SiteAnalyzer SEO Tools!
Our powerful browser extension seamlessly integrates with Google Search Console data via the official Google API, delivering comprehensive site insights literally at your fingertips – with just one click!
Browser extension SiteAnalyzer SEO Tools, enhanced with the Google Search Console module, is your ultimate SEO companion among browser extensions!
Why SEO professionals and webmasters choose SiteAnalyzer SEO Tools:
- Instant access to page – and domain-level data: View the top-performing search queries driving clicks and impressions for the current page or your entire domain – with just a single click.
- Advanced filtering and sorting: Leverage multi-layer filters, N-gram analysis, and multi-column sorting for in-depth keyword performance insights.
- Performance comparison: Compare keyword metrics against previous periods or the same timeframe from the prior year to track trends and growth.
- Comprehensive metrics dashboard: Monitor total clicks, impressions, average CTR, and average positions in an intuitive, interactive dashboard – displayed at both page and keyword levels.
- Secure and official integration: Connect via Google OAuth 2.0 with read-only permissions, ensuring your data remains secure and private.
- User-friendly interface: Enjoy an intuitive design with advanced parameter controls, pagination, and quick filters for efficient, streamlined analysis.
- Data export and saving: Export filtered datasets directly to CSV files for further reporting or offline analysis.
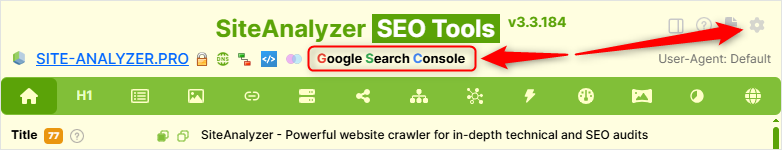
How to access the module
The link to the analytics module is available at the top of the extension interface, as well as in the Settings section.
Authorizing in the Google Search Console module
Google Account Selection pop-up window for signing in to Google Search Console.
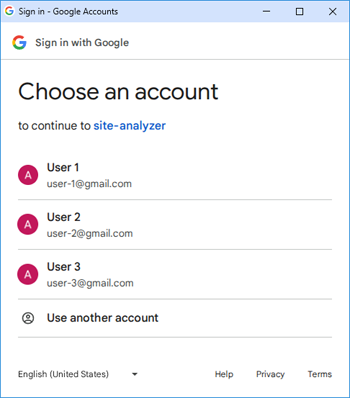
After clicking the “Sign in to account” button, you’ll be directed to the Google Search Console module, which displays a list of your account’s verified properties. From there, you can navigate through the following sections:
- Data Sampling & Display Settings
- БSite Performance Overview
- Advanced Filters & Insights
- Data Export & Filtering
- Video
Notes
- Only verified websites from your Google account are displayed in the site list.
- To switch accounts, click the “Switch Account” button in the SiteAnalyzer SEO Tools extension, then complete the account-switching process in your browser within the Google Search Console interface, and finally sign back into the desired account through the extension.
Data Sampling & Display Settings
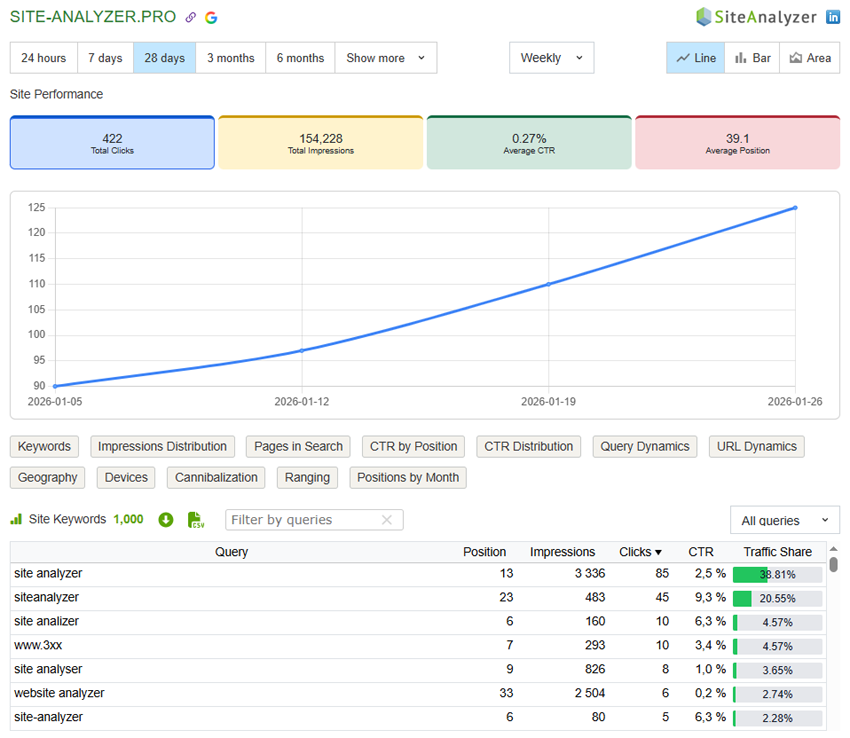
At the top of the analytics module, you’ll find a control panel for selecting date ranges, configuring data filters, and choosing how metrics are visualized on charts.

- Available date ranges for Google data: Last 24 hours, Last 7 days, Last 28 days, Last 3 months, Last 6 months, Last 12 months, Last 16 months, Last 24 months, Custom range – to define any arbitrary period.
- Chart data grouping options: By day, By week, By month.
- Chart visualization types: Line, Bar, Area.
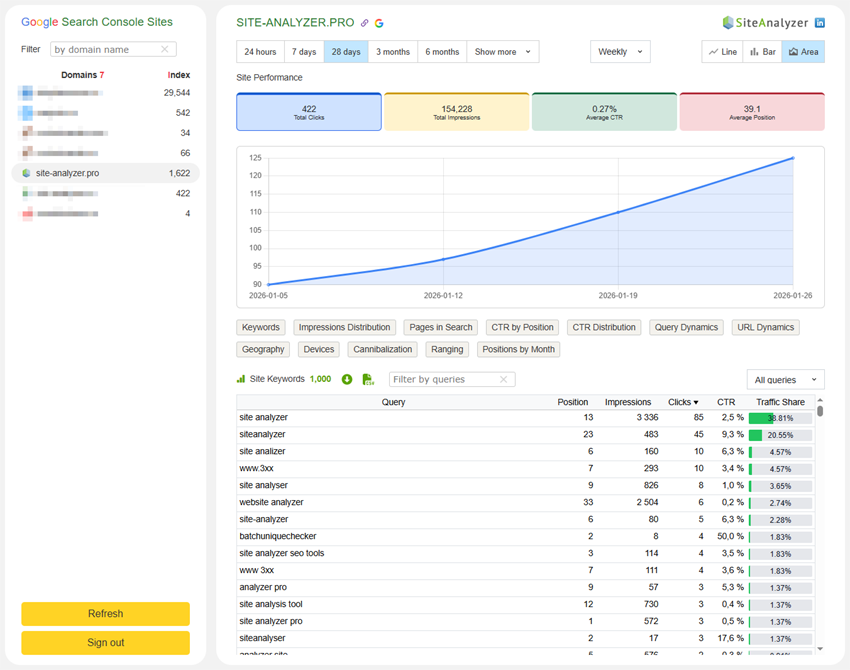
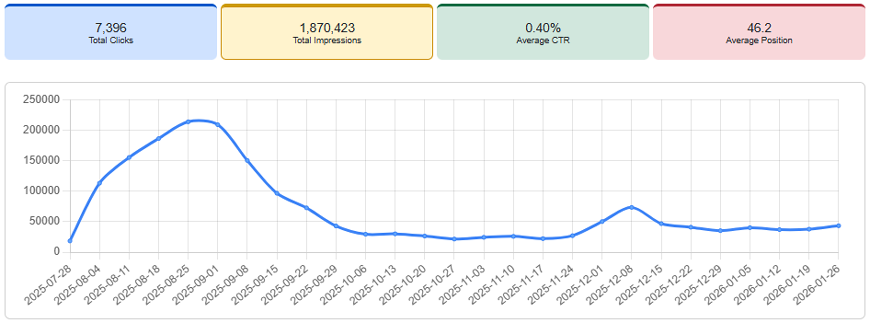
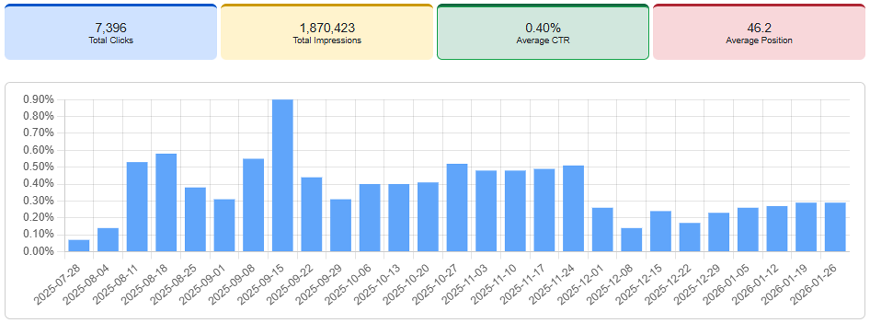
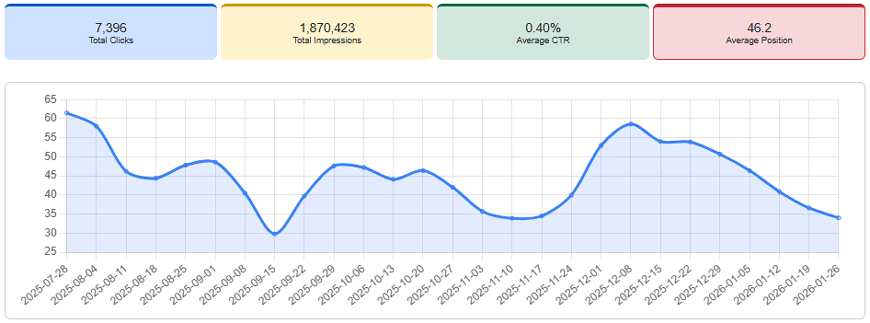
Site Performance Overview
This section features four key metric blocks: Total Clicks, Total Impressions, Average CTR, Average Position.
Represents the total number of clicks from Google Search results during the selected period. By default, the keyword table is sorted by the “Clicks” column. The “Traffic Share” column shows each query’s share of total search traffic relative to all keywords displayed in the table.
In the top-right corner of the table, you’ll find the “All Queries” toggle – a powerful filter that segments queries by word count. This isn’t just about classic N-grams; it’s a strategic way to uncover fresh content ideas based on what users are actually asking – especially in the era of AI-Search.
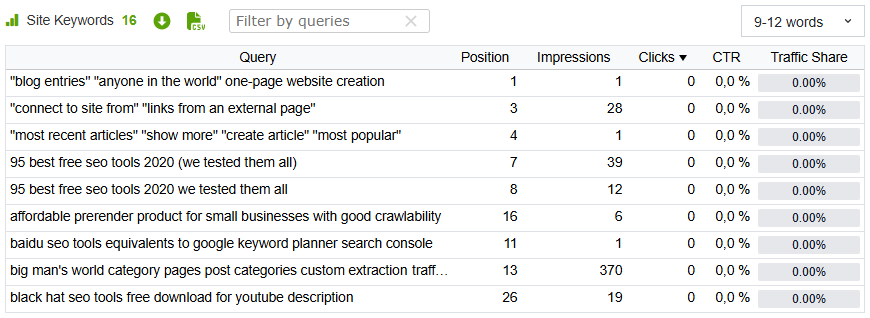
Google isn’t hiding “AI Search” data from you – you just don’t know where to look for it (с)
Nowadays, search increasingly includes longer, AI-generated-style queries. Segmenting by query length has become essential for understanding user intent.
Recent changes in Google’s search behavior make recognizing your own query patterns more critical than ever.
Using this filter is essentially an official “hack” of Google Search Console – it reveals exactly what users are asking about your industry in AI Overviews.
Here’s the secret: Query length signals intent. People talk to AI like this: “Which running sneakers are best for winter?”. These long-tail queries – especially those with 7+ words – are precisely what users type into AI search modes. If you’re not answering these specific questions in your H2 headings or FAQ sections, you’re handing that traffic over to ChatGPT or your competitors.
- Short queries = Broad (exploratory) or navigational intent
- Longer queries = Specific intent / AI prompts
Of course, you could extract such queries manually in Google Search Console using regular expressions – but with our extension, it’s just one click away. And let’s be honest – that’s incredibly convenient.
P.S. Stop optimizing for 2-3-word keywords. Start optimizing for 7-word queries! :-)
The total number of times your site appeared in Google Search results during the selected period. By default, the keyword table is sorted by the “Impressions” column.
Your site’s average click-through rate (CTR) for the selected period. The keyword table is sorted by the “CTR” column by default.
The average ranking position of your search queries during the selected period. The keyword table is sorted by the “Position” column by default.
Advanced Filters
Located below the main chart, this section provides deep-dive insights into your site’s performance – covering keywords, indexed pages, geographic traffic sources, device types, and other critical datasets not readily visible in the native Google Search Console interface.
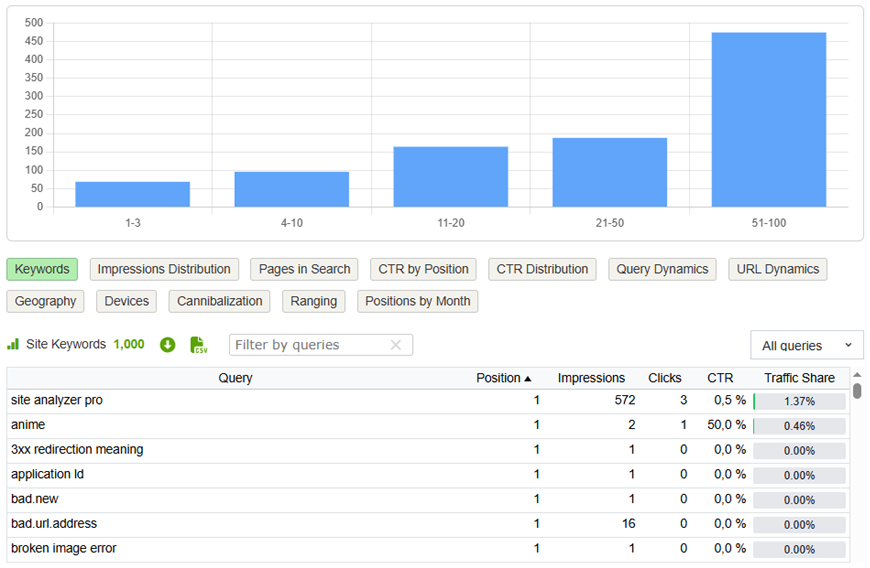
Displays a list of your site’s keywords for the selected period, sorted by “Position”. Above the table, a chart visualizes the distribution of keyword positions across key ranges: 1-3, 4-10, 11-20,21-50, 51-100.
The "Word Map" filter allows for a visual representation of the distribution of unique words from a site’s semantic core by impressions and mentions relative to their total number of repetitions, in a simple and clear format.
When clicking on word groups, it is possible to filter them relative to their mentions in key phrases.
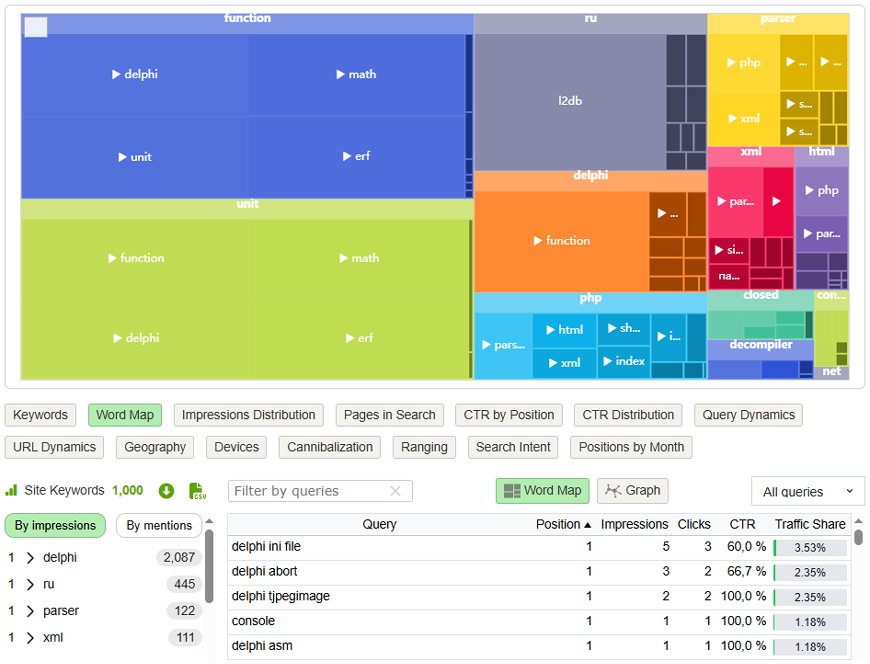
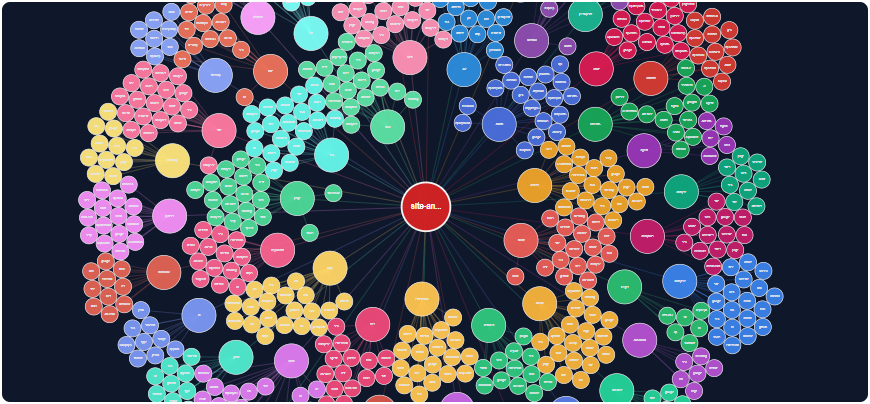
Additionally, when switching the map display mode to the “Graph”, it is possible to visualize the representation of keyword groups on the graph. In this case, for ease of presentation, each group is highlighted in a separate color.
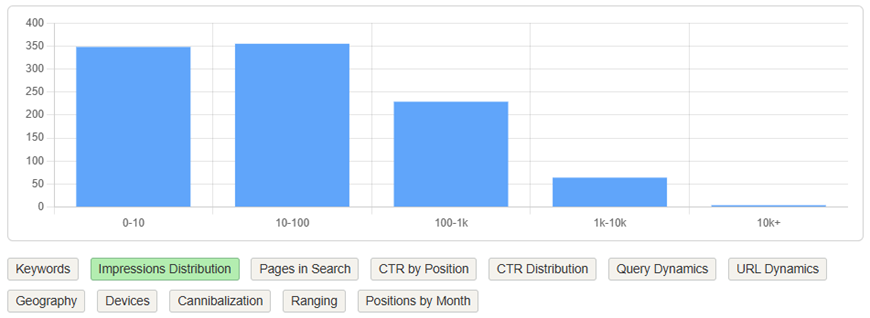
Shows how impressions are distributed across keyword volume tiers using a bar chart: 0-10, 10-100, 100-1K, 1K-10K, 10K+.
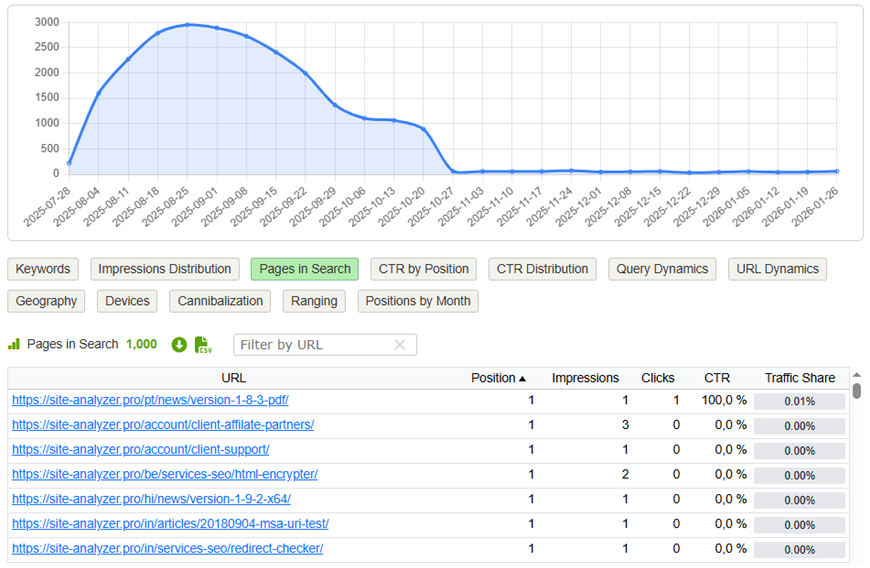
Lists all your site’s URLs that received impressions during the selected period, with filtering options. A line chart above the table displays the trend in the number of indexed/searched pages over time.
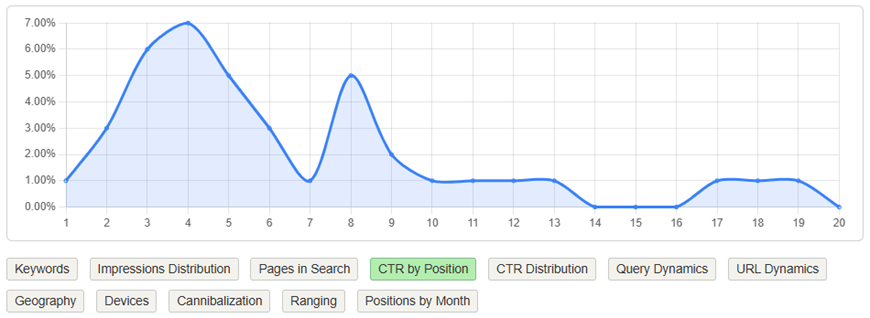
Visualizes how CTR varies depending on ranking position throughout the selected period – helping identify performance gaps at specific rank tiers.
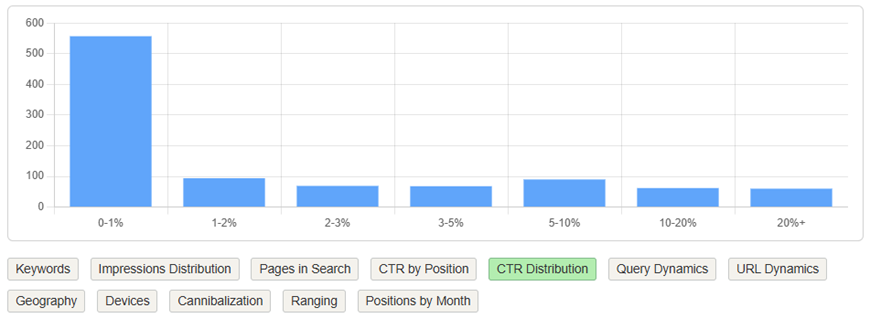
Presents a histogram of CTR values across your keywords, grouped into ranges: 0-1%, 1-2%, 2-3%, 3-5%, 5-10%, 10-20%, 20%+.
Compares keyword performance (position, clicks, impressions, CTR) between today and a selected historical period. Available comparison windows: 30 days, 3 months, 6 months, 12 months.
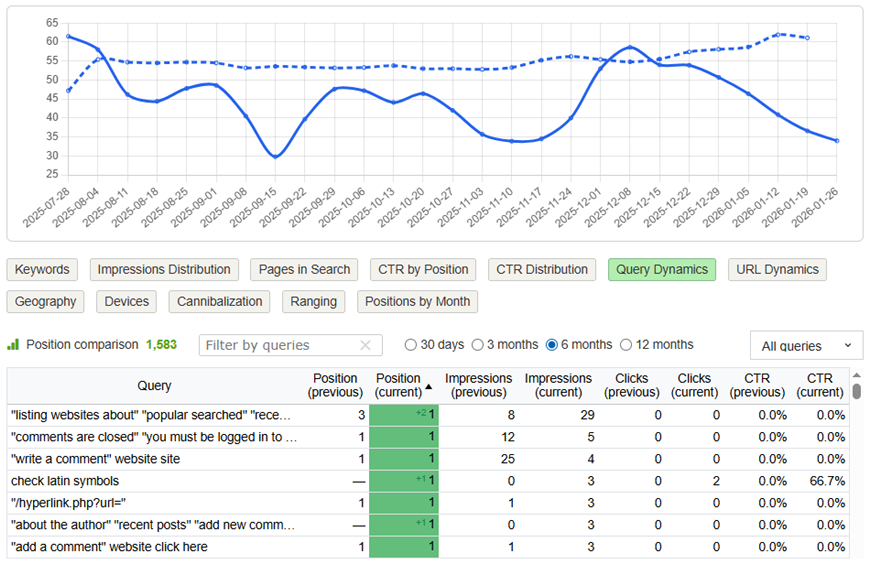
Use this to instantly spot which queries have climbed into the Top rankings – and which ones need urgent optimization.
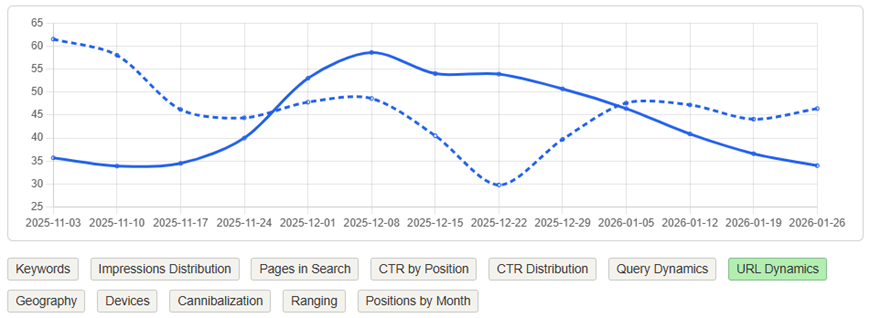
Functions similarly to “Query Performance Trends,” but tracks changes at the URL level instead of keywords. The chart shows position shifts for each page between today and your chosen reference period.
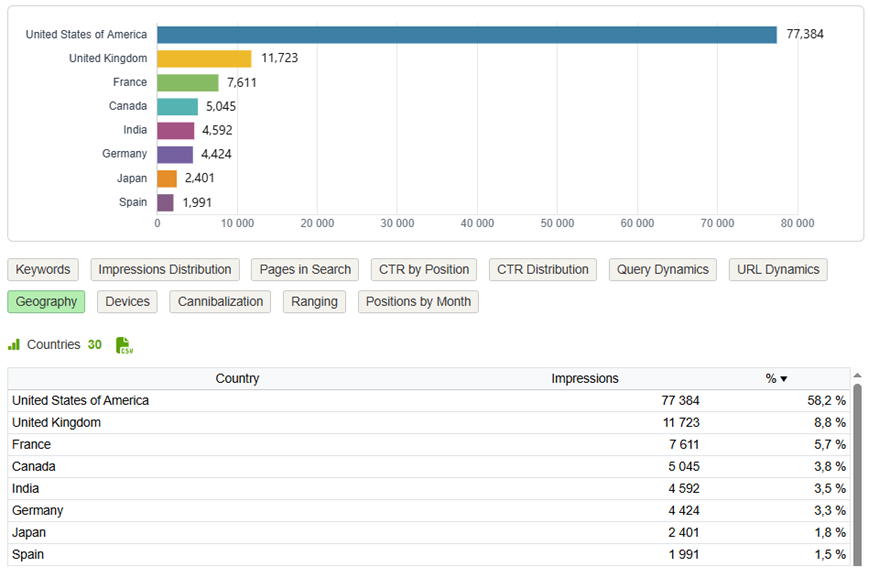
Displays traffic distribution by country. The chart highlights the Top 8 countries from your total dataset.
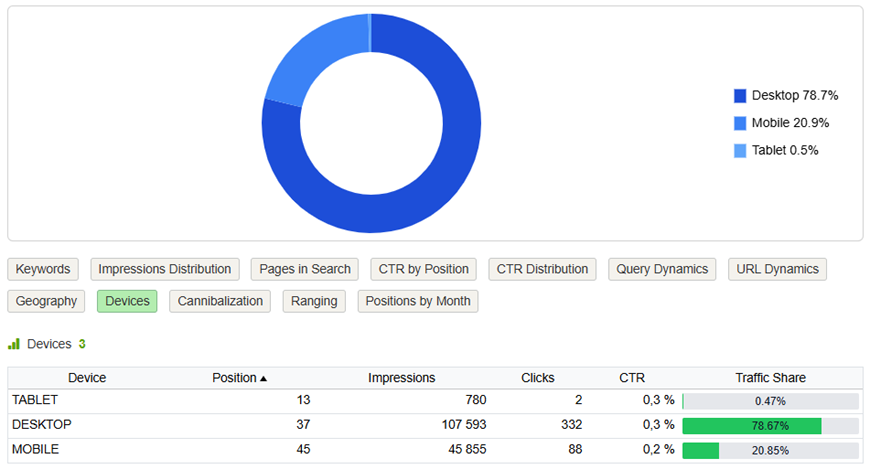
Shows the percentage breakdown of traffic by device type: Desktop, Mobile, Tablet.
This feature automatically detects SEO cannibalization issues using Google Search Console data-specifically, when multiple pages from your site compete for the same keywords in search results. To make analysis easier, groups of cannibalizing queries are visually separated by alternating background colors, allowing you to quickly identify which sets of pages are overlapping in their keyword targeting. This helps you consolidate content, clarify page focus, and eliminate internal competition that may be hurting your rankings.
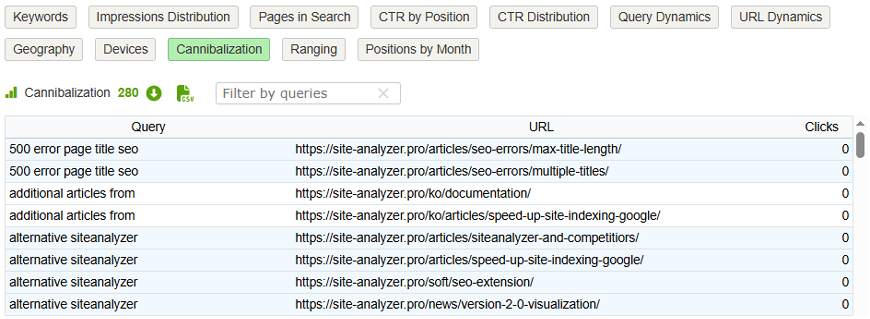
With one click, uncover all cannibalized queries among thousands, making it easy to consolidate or differentiate content strategy.
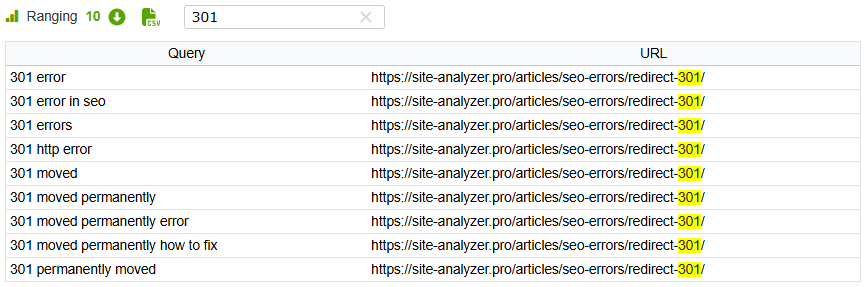
Allows you to filter keywords by specific URLs (or URL patterns). Ideal for identifying which keyword sets are driving traffic to particular pages – or revealing unexpected ranking overlaps.
This filter visualizes the distribution of search intent across your current keyword set using a pie chart. Search intent refers to the underlying goal a user has when typing a specific query into the search engine. The main intent types are: Commercial – the user is considering a purchase and comparing options. Informational – the user is seeking knowledge, answers, or general information. Navigational – the user is trying to find a specific website, brand, or physical location. Transactional – the user intends to complete an action, such as making a purchase, signing up, or downloading something.
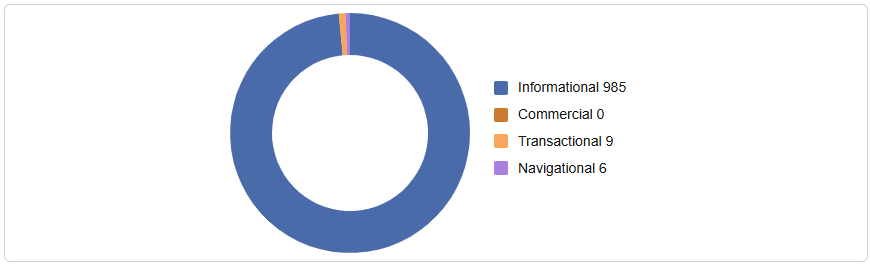
Understanding intent helps you align your content with what users truly want – improving relevance, engagement, and conversion potential.
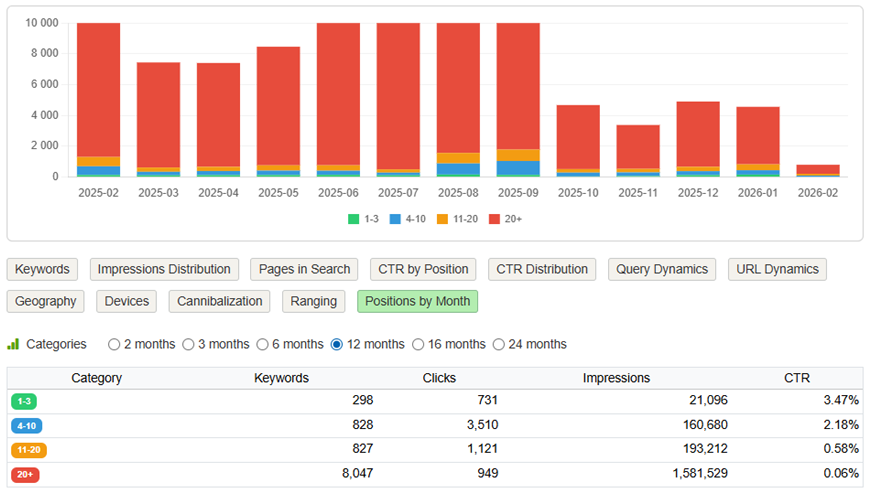
Displays the number of keywords ranked in key position ranges (1-3, 4-10, 11-20, 20+) by month, using a stacked histogram. This helps track long-term visibility trends and seasonal fluctuations.
Data Export & Filtering
- One-click CSV export of all keywords / URL / data for the current project.
- Google Search Console interface allows exporting no more than 1,000 queries. To bypass this limitation, the easiest way is to use the Google Search Console module in "SiteAnalyzer SEO Tools".
- The "Load All Rows" icon is intended for additional import of ALL data from Google if there are more than 1,000 rows. For projects with over 25,000 data rows, the import process may take a considerable amount of time.
- Export to PDF – This feature allows you to export ENTIRE project data into a single PDF file, making it convenient for sending a report to a client or passing the file to marketers or SEO specialists for further offline website analysis. Download a sample PDF report (2.3 MB).
Video review
Other Updates
- Resolved data-fetching issues from Similarweb in Firefox
- Added persistence for the collapsed / expanded state of the "SERP Analysis" panel
That’s all for now! :-)
If you have ideas on how to make the tool even better – drop us a message in our Linkedin channel. We’re open to any suggestions to improve this module!
Other articles: